Apex Paper Trading Terminal — TradingView-Style Workspace in React
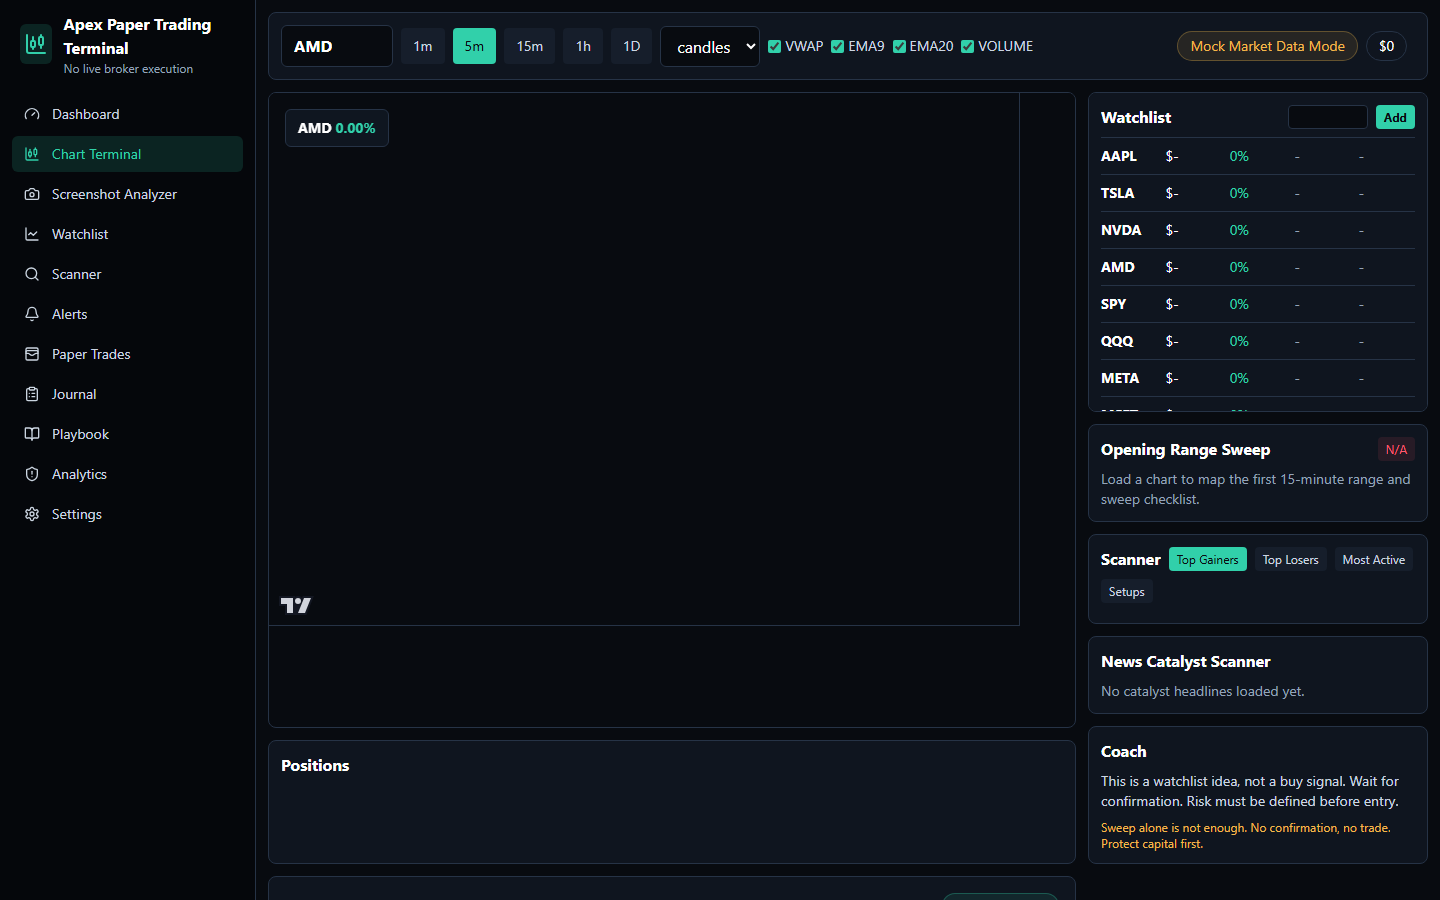 Apex Paper Trading Terminal — chart workspace with watchlist, scanner, and AI coach panel
What I Built
Apex is a TradingView-inspired paper trading workspace built entirely in React. It’s a market-watching, setup-scanning, alert-tracking, and journaling tool — backed by Alpaca paper trading for order simulation. No real money, no live broker execution. Just a clean workspace for studying the markets and testing strategies.
Why Paper Trading
Before going live with any strategy, I wanted a way to actually prove it works. Apex is the tool I built to do that systematically. The paper account starts at $100,000 and every trade is logged, analyzed, and tracked against a target win rate.
Features
- Live Charts — TradingView Lightweight Charts integration with multiple timeframes
- Watchlist — track tickers with real-time price data via yfinance
- Setup Scanner — scan for technical setups based on configurable criteria
- Alerts — price and condition-based alert system
- Trade Journal — log entries with screenshots, notes, and outcome tracking
- Analytics Dashboard — win rate, P&L curves, average RR, trade breakdown by setup type
- Alpaca Integration — paper order submission and position tracking via alpaca-py SDK
Tech Stack
- React 18 + TypeScript
- Vite (port 5173)
- Tailwind CSS
- TradingView Lightweight Charts
- Node.js + Express (API layer)
- Alpaca paper trading SDK
- yfinance for market data
The Goal
The trading goal is simple: prove a consistent ~60% win rate on paper before touching real money. The terminal is designed to make that process as disciplined and data-driven as possible — journaling every trade, reviewing setups, and letting the analytics tell the story over time.
What I Learned
Working with financial chart libraries taught me a lot about performance optimization. Lightweight Charts is designed to handle thousands of candles without lag, but getting the React integration right (especially around resize observers and series updates) required careful state management. I also learned a lot about Alpaca’s WebSocket streaming API for real-time data feeds.
The biggest lesson though was about trading itself — having a tool that forces you to document your reasoning before entering a trade is incredibly valuable. The journal feature alone changed how I think about setups.